Loading HPI data...
No Data Available
Error fetching NOAA data. This may be a connection or NOAA service issue – please retry.
Data source: NOAA Hemispheric Power Index
NOAA Space Weather Prediction Center provides all forecast data in UTC (Coordinated Universal Time), which is the standard time used worldwide for scientific and meteorological data. However, for Alaska viewers, it's more practical to see the local time as well.
→ To convert UTC to Alaska Time: Subtract 9 hours in winter (AKST) or 8 hours in summer (AKDT)
→ Example: UTC = Alaska Time (current time)
→ NOAA forecast updates typically occur at 22:05 UTC daily (around Alaska Time )
30-Minute Aurora Forecast
Updated every 30 minutes. The timestamp shows when the forecast was generated in UTC.
3-Day Kp Forecast
Shows predicted Kp index values in 3-hour intervals. Times are typically displayed in UTC.
Historical Data
All historical timestamps from NOAA are in UTC. Use the conversion tips above to understand when events occurred in Alaska time.
Key Takeaway: When reading NOAA forecast timestamps, remember they're in UTC. Use the Alaska Time display to know when it's actually dark and prime viewing time in your location!
Alerts based on overall geomagnetic activity. Works regardless of location.
Triggers when Kp ≥ or HPI ≥ 50
Alerts when Kp reaches your threshold. Higher values (5+) extend visibility to lower latitudes.
Triggers when Kp ≥
Alerts when NOAA issues official storm warnings (G1-G5 scale).
Scale: G1 (Kp 5) → G5 (Kp 9)
Intelligent alerts that consider your viewing location, Kp thresholds, and cloud cover. Only notifies when conditions are actually favorable for viewing.
Selected: (Requires Kp +)
🧠 How Smart Alerts Work:
Current Status:
Kp Index: ✓ Above threshold ⚠ Below threshold
Required Kp: +
Cloud Cover: ✓ Clear ⚠ Some clouds ✗ Too cloudy
How You'll Receive Alerts
PWA Mode (Installed App): When you install this app to your home screen, alerts are delivered via Service Worker notifications. These work even when the app is closed, providing background alerts without keeping the browser open. Notifications include vibration and can appear even when your device is locked.
Web Browser Mode: When using the app in a regular browser tab, alerts use standard browser notifications. These require the browser tab to be open (or running in the background) and may not work when the browser is completely closed. For best results, install the app as a PWA.
Note: Both modes require notification permission. You'll be prompted to allow notifications when you first enable an alert type. You can manage notification permissions in your browser or device settings.
Status:
© Northern Lights Alaska (NLAK). All rights reserved.
Data provided by NOAA Space Weather Prediction Center
Learn how to interpret the aurora forecast maps and understand what the colors and patterns mean for your viewing location.
Dark Green
Weak Activity
Green
Moderate Activity
Yellow
Strong Activity
Orange/Red
Very Strong Activity
The colors on the forecast maps show how strong the aurora will be. Think of it like a weather map for northern lights: Dark Green means weak aurora, Green means moderate, Yellow means strong, and Orange/Red means very strong aurora activity. Brighter colors mean you're more likely to see the northern lights!
Fairbanks & Interior: Typically visible with Kp 0-2. Look for green areas covering Alaska on the map.
Anchorage & South Central: Usually need Kp 5+ for reliable viewing. Orange/red areas over Alaska indicate good conditions.
Southeast Alaska: Requires Kp 6+ for visibility. Strong activity (red/purple) needed for these lower latitude locations.
North Slope: Can see aurora even at very low Kp values. Any green on the map usually means visible aurora.
Best viewing times: 10 PM - 2 AM Alaska Time, especially during winter months
These maps show the geographic range where aurora is visible at different Kp index levels. Higher Kp values mean aurora is visible further south and with greater intensity.
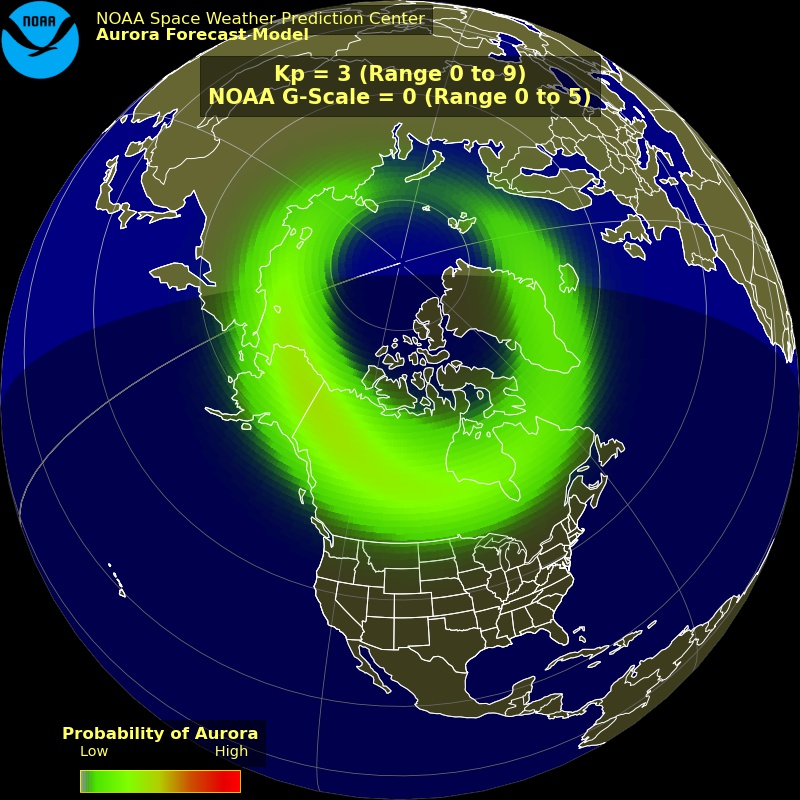
Kp Value: Kp = 3 (Range 0 to 9)
NOAA G-Scale: G0 (Range 0 to 5)
Aurora is visible in a relatively narrow ring around the North Pole, covering northern Canada, Alaska, Greenland, Iceland, and parts of northern Scandinavia and Russia.
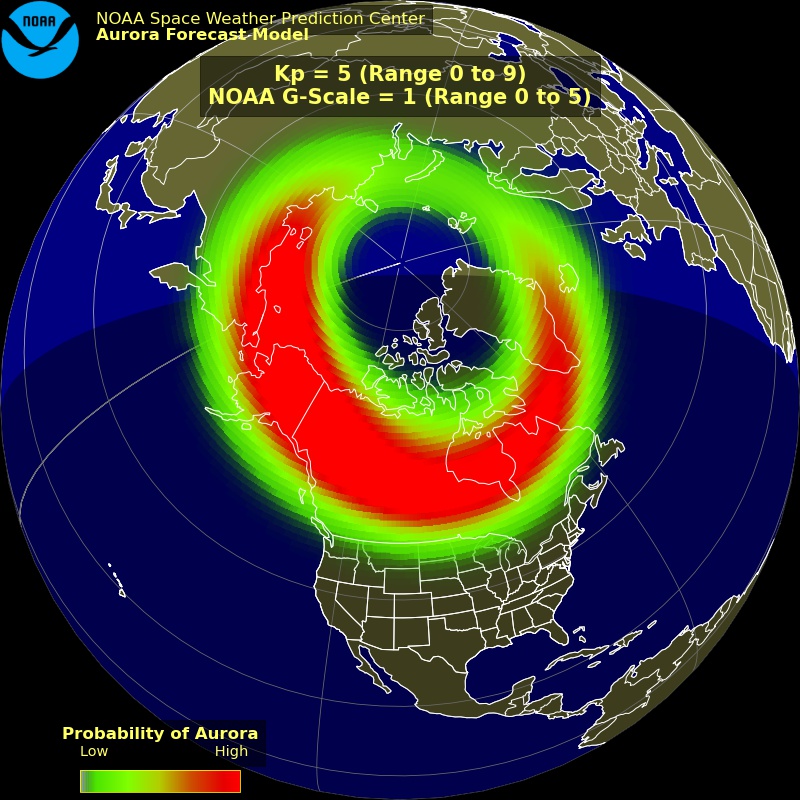
Kp Value: Kp = 5 (Range 0 to 9)
NOAA G-Scale: G1 (Range 0 to 5)
The aurora ring is wider and more intense, reaching farther south into the northernmost contiguous United States.
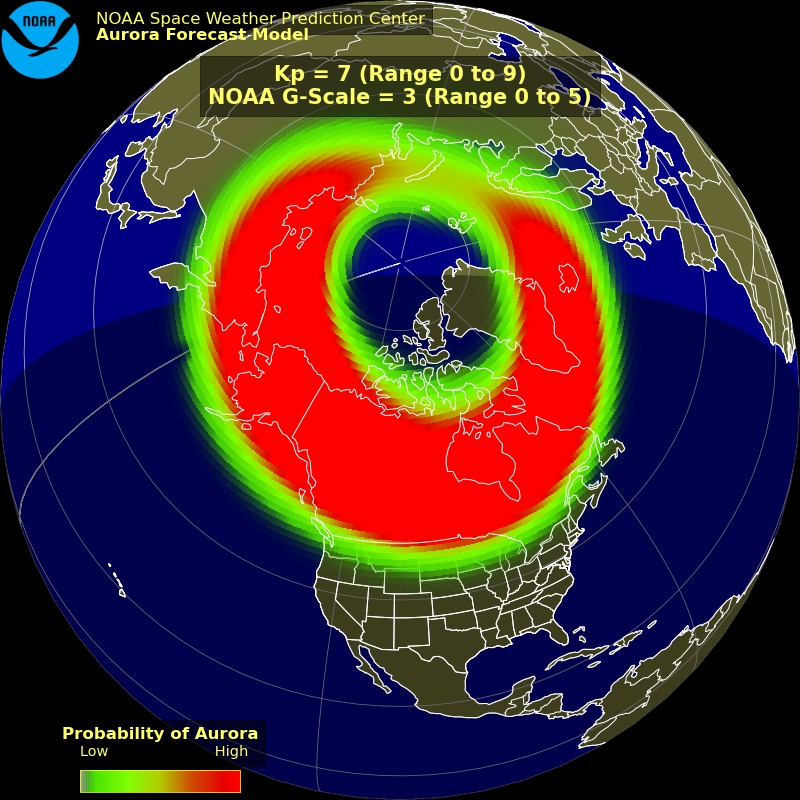
Kp Value: Kp = 7 (Range 0 to 9)
NOAA G-Scale: G3 (Range 0 to 5)
The aurora ring is significantly wider and predominantly red, extending deep into the continental United States.
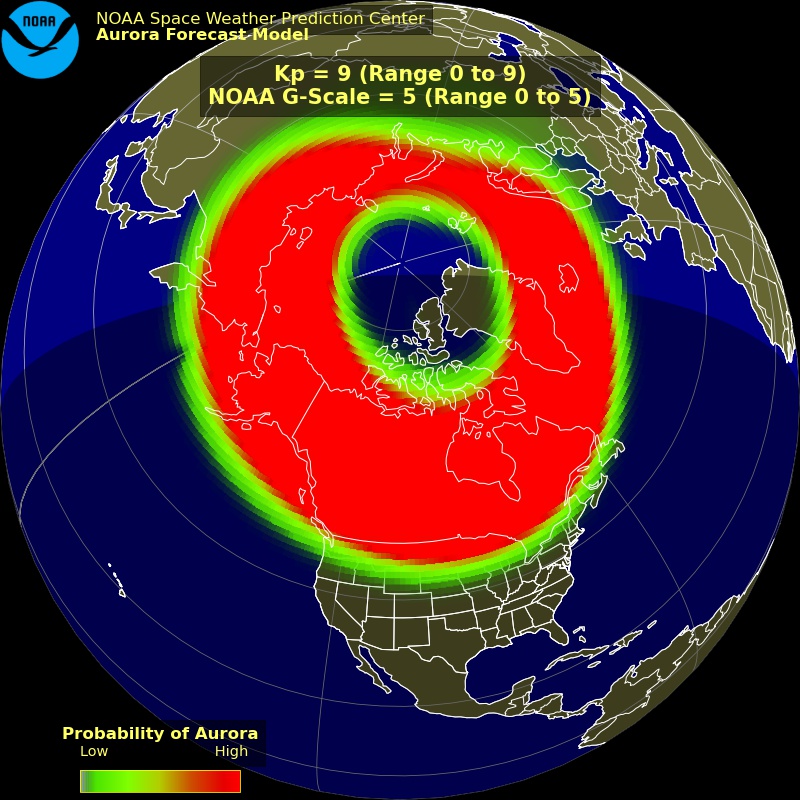
Kp Value: Kp = 9 (Range 0 to 9)
NOAA G-Scale: G5 (Range 0 to 5)
The aurora's visibility extends to very low latitudes, potentially reaching states as far south as Oregon, Idaho, Nebraska, and New York.
NOAA Aurora Forecast - Shows where and how strong the northern lights will be.
The colors tell you the aurora strength:
Loading NOAA 24-hour loop...
No animation frames available
Animation built with NOAA's OVATION auroral forecast archive. Use the speed control to adjust playback rate. Frames automatically advance using an HTML5 canvas renderer.
NOAA Aurora Forecast - Shows where and how strong the northern lights will be.
The colors tell you the aurora strength:
Loading NOAA 24-hour loop...
No animation frames available
These HTML5 animations replay the NOAA southern hemisphere OVATION frames so you can compare polar views without leaving the dashboard.
Tonight's Static Viewline Forecast - Shows predicted aurora viewing conditions for tonight
This forecast map displays the expected aurora visibility and intensity for the current night, helping you plan your viewing session.
Tomorrow Night's Static Viewline Forecast - Shows predicted aurora viewing conditions for tomorrow night
Plan ahead with this forecast map displaying expected aurora visibility and intensity for tomorrow night, helping you prepare for your next viewing opportunity.
No Active Alerts
There are currently no active space weather alerts.
No Recent CME Events
No coronal mass ejections detected in the last 7 days.
Source: NOAA Space Weather Prediction Center
CME Type uses the SCORE Scale: S (Slow <500 km/s), C (Common 500-999 km/s), O (Occasional 1000-1999 km/s), R (Rare 2000-2999 km/s), E (Extreme ≥3000 km/s)
Physical Measure: X-ray flux (M1 = 10⁻⁵, M5 = 5×10⁻⁵, X1 = 10⁻⁴, X10 = 10⁻³, X20 = 2×10⁻³)
Effects: HF radio communication degradation or blackout on sunlit side of Earth. Navigation signal degradation.
Frequency: R1 occurs ~2000 times per solar cycle (950 days), R5 less than 1 per cycle.
Full NOAA Scales ExplanationPhysical Measure: Flux of ≥10 MeV particles (S1 = 10, S2 = 10², S3 = 10³, S4 = 10⁴, S5 = 10⁵ particles/cm²·s·sr)
Effects: Radiation hazards for astronauts and high-altitude aircraft. Satellite operations affected. HF radio blackouts in polar regions.
Frequency: S1 occurs ~50 times per cycle, S5 fewer than 1 per cycle.
Full NOAA Scales ExplanationPhysical Measure: Kp index (G1 = Kp 5, G2 = Kp 6, G3 = Kp 7, G4 = Kp 8-9-, G5 = Kp 9)
Effects: Power grid fluctuations, satellite operations issues, HF radio propagation problems, aurora visibility at lower latitudes.
Aurora Visibility: G1 (Kp 5) = high latitudes (northern Michigan/Maine), G3 (Kp 7) = Illinois/Oregon, G5 (Kp 9) = Florida/Texas!
Frequency: G1 occurs ~1700 times per cycle (900 days), G5 only 4 times per cycle (4 days).
Full NOAA Scales ExplanationM-class and X-class flares can produce coronal mass ejections (CMEs) that reach Earth 1-3 days later, potentially triggering strong geomagnetic storms and spectacular aurora displays. However, not all flares produce CMEs, and CME direction matters—they must be Earth-directed to affect our planet.
Loading X-ray flux data...
Monitor real-time solar wind speed and magnetic field data that directly influence aurora australis and borealis activity for accurate geomagnetic storm forecasting.
Loading Bz data...
No Data Available
Error fetching NOAA data. This may be a connection or NOAA service issue – please retry.
Data source: NOAA Solar Wind
Bz Component: A negative Bz (below 0) is favorable for aurora activity. Values below -10 nT typically trigger strong aurora displays.
Loading solar wind speed data...
No Data Available
Error fetching NOAA data. This may be a connection or NOAA service issue – please retry.
Data source: NOAA Solar Wind
Solar Wind Speed: Faster solar wind (above 500 km/s) increases the chance of aurora activity. Current estimated arrival time:
The Bz component represents the direction of the Sun's magnetic field as it reaches Earth. When Bz turns southward (negative values), it creates an opening in Earth's protective magnetic shield, enabling charged particles from the solar wind to penetrate our atmosphere and generate aurora displays.
The Sun continuously emits a flow of energized particles known as solar wind. This stream carries the Sun's magnetic field and varies in speed, density, and direction. When these particles interact with Earth's magnetosphere, they can trigger geomagnetic activity that produces visible aurora, with higher wind speeds often leading to more intense displays.
Space weather satellites monitor solar wind conditions at the L1 Lagrange point, approximately 1.5 million kilometers sunward from Earth. Since these particles travel at varying speeds, there's a time delay between when we detect changes in the solar wind and when those particles actually reach and affect Earth's magnetic environment.
Cycle
Phase
Activity
Progress
Note: Solar cycles last approximately 11 years. Peak activity periods (around 50% progress) typically produce more frequent and intense aurora displays.
Current Time (Alaska)
Status
Prime Viewing Hours
Tip: Aurora is most active between 10 PM and 2 AM Alaska Time. Plan to arrive at your viewing location 30 minutes before prime time to allow your eyes to adjust to darkness.
Get notified when Kp reaches or higher for your location
Visibility
Kp Index
Confidence
Where to Look
Bz Component:
Solar Wind Density:
Like Aurora Alerts app's long-range forecast tab - Kp values broken down in 3-hour increments. This helps you plan when conditions will be best for viewing.
Time Zone: Times shown in Alaska Time (AKST/AKDT) with UTC equivalent. Dates and times are displayed for each forecast period.
Alaska:
UTC:
Note: Forecasts are estimates. Actual Kp may vary. Always check real-time data at SpaceWeatherLive.com before heading out.
Monitor the power and intensity of aurora australis and borealis activity in real-time with our HPI (Hemispheric Power Index) chart for accurate aurora forecasting.
Loading HPI data...
No Data Available
Error Loading Data
Data source: NOAA Hemispheric Power Index
The Hemispheric Power Index (HPI) measures the total energy input into the Earth's atmosphere in gigawatts (GW). Higher values indicate stronger aurora activity and better visibility. Typically, values above 40 GW can produce visible aurora in high latitude regions.
Last updated:
Loading HPI data...
No Data Available
Error fetching NOAA data. This may be a connection or NOAA service issue – please retry.
Data source: NOAA Hemispheric Power Index
A full-screen, science-grade control surface for every Kp chart we publish. Validate the dataset lineage, then drill into historical holdings grouped by decade—each badge launches the corresponding chart canvas in a new research tab.
Archive Span
Chart-Ready
yrs
kp-index/history/years.json, preventing brittle, hand-built filenames.
localStorage for six hours so field devices stay under 100 KB JS budget.
Core feeds
RSGA · SGAS · DGD (NOAA SWPC)
Daily geomagnetic summaries plus three-hour Kp bins.
Chart runtime
Chart.js 4.4 + Tailwind Scientific preset
Shared options keep tooltips aligned with the main dashboard canvases.
Kp is a planetary average, not a local measurement. The Kp (planetary K) index is derived from measurements at 13 geomagnetic observatories worldwide and represents global geomagnetic activity, not conditions at your specific location.
High-latitude Alaska considerations: In auroral-zone regions like Alaska, short-lived but intense aurora "substorms" can occur even when Kp values appear low. The Kp index may miss localized aurora activity. Low Kp values do not guarantee there will be no aurora—aurora may still appear, particularly in northern or remote areas.
Forecast uncertainty: Extended forecasts (27-day outlooks) provide only rough estimates. Solar wind, magnetic field orientation, and transient events fluctuate unpredictably, limiting accuracy beyond a few days—or even hours.
Loading 3-day forecast data...
No Data Available
Error fetching NOAA data. This may be a connection or NOAA service issue – please retry.
Data source: NOAA 3-Day Geomagnetic Forecast
Forecast Period:
Note:
Last updated:
Source: NOAA Space Weather Prediction Center | NOAA Dashboard | JSON Data
Loading 7-day forecast data...
No Data Available
Error fetching NOAA data. This may be a connection or NOAA service issue – please retry.
Data source: NOAA 3-Day Forecast & 27-Day Outlook
Forecast Period:
Note: Days 4-7 use longer-range outlook data which is less accurate than the 3-day forecast.
Last updated:
Source: NOAA Space Weather Prediction Center | NOAA Dashboard | JSON Data
Loading 27-day forecast data...
No Data Available
Error fetching NOAA data. This may be a connection or NOAA service issue – please retry.
Data source: NOAA 27-Day Space Weather Outlook
The data: Highlighted in blue are 3-Day Forecast data overlaying the 27-Day Forecast. 3-Day Forecast data are updated daily and provides a more accurate forecast.
Last updated:
Source: NOAA Space Weather Prediction Center | NOAA Dashboard | JSON Data
Loading historical data...
No Data Available
Error Loading Data
Data source: NOAA Daily Geomagnetic Data
The data: We display the most recent observed NOAA Daily Geomagnetic Data.
Last updated:
Source: NOAA Space Weather Prediction Center | NOAA Dashboard | JSON Data
Live all-sky camera feeds from the University of Alaska Fairbanks Geophysical Institute. These cameras provide real-time views of the night sky to help you see current aurora activity.
Located near Fairbanks, Alaska. This camera provides views of aurora activity in the Interior region.
Auto-refreshes every 15 seconds • Always shows newest image
Located in the Arctic tundra, north of the Brooks Range. This camera provides views of aurora activity in the far north.
Auto-refreshes every 30 seconds
Located in the Interior region of Alaska. This camera provides additional coverage of aurora activity.
Auto-refreshes every 30 seconds
Plays a loop of all available tagged images from the Poker Flat directory, similar to the OVATION 24-hour loop. This time-lapse shows the progression of aurora activity captured by the Poker Flat all-sky camera.
All available tagged images from the Poker Flat directory, played in chronological order.
Loading Poker Flat image sequence…
No recent Poker Flat images available for time-lapse playback.
Click "Play Loop" to load images from the Poker Flat directory.
100% cloud cover means no lights will be seen, regardless of Kp index. Always check cloud conditions before heading out. In Fairbanks, you can see aurora even at Kp 0-1 if skies are clear!
5-day weather forecast for top viewing locations. Plan ahead for the best aurora viewing conditions.
Time Zone: All dates and times shown in Alaska Time (AKST/AKDT).
Loading 5-day forecast...
Unable to load weather forecast data.
Data source: Weather forecast data from Open-Meteo. Forecasts are estimates and may vary. Always check current conditions before heading out.
Northern Hemisphere
Aurora Borealis
Southern Hemisphere
Aurora Australis
The chart above shows the typical altitude ranges where different aurora colors appear. Red aurora occurs at the highest altitudes (300-600 km) where atomic oxygen is sparse, requiring intense solar activity. Green aurora is most common (100-300 km) where atomic oxygen concentration is higher. Blue/Purple aurora appears at lower altitudes (80-200 km) where molecular nitrogen dominates. The colors overlap because aurora can occur across multiple altitude ranges simultaneously during active periods.
Key Insight: The altitude determines which atmospheric molecules are excited. At high altitudes (300-600 km), sparse atomic oxygen emits red light (630.0 nm). At mid-altitudes (100-300 km), more abundant atomic oxygen emits green light (557.7 nm). At lower altitudes (80-200 km), molecular nitrogen emits blue/purple light (427.8 nm). During intense geomagnetic storms, all three can appear simultaneously, creating spectacular multi-colored displays.
Even though auroras are best seen at night, they are actually caused by the Sun. The Sun sends us more than heat and light; it sends lots of other energy and small particles our way. The protective magnetic field around Earth shields us from most of the energy and particles, and we don't even notice them.
Solar Storms: The Sun doesn't send the same amount of energy all the time. There is a constant streaming solar wind and there are also solar storms. During one kind of solar storm called a coronal mass ejection, the Sun burps out a huge bubble of electrified gas that can travel through space at high speeds.
Magnetic Field Lines: When a solar storm comes toward us, some of the energy and small particles can travel down the magnetic field lines at the north and south poles into Earth's atmosphere. There, the particles interact with gases in our atmosphere resulting in beautiful displays of light in the sky. Oxygen gives off green and red light. Nitrogen glows blue and purple.
Aurora on Other Planets: Auroras are not just something that happen on Earth. If a planet has an atmosphere and magnetic field, they probably have auroras. We've seen amazing auroras on Jupiter and Saturn!
Altitude: 300-600 km (186-373 miles)
Scientific Name: Type A Aurora (Atomic Oxygen - 630.0 nm)
Rare, high-altitude aurora. Most visible during intense geomagnetic storms. Often appears as a diffuse red glow above green aurora.
Altitude: 100-300 km (62-186 miles)
Scientific Name: Type B Aurora (Atomic Oxygen - 557.7 nm)
Most common aurora color. Bright green curtains and bands. This is what most people see and photograph in Alaska.
Altitude: 80-200 km (50-124 miles)
Scientific Name: Type C Aurora (Molecular Nitrogen - 427.8 nm)
Lower altitude aurora. Often appears at the bottom of green aurora curtains. More visible to cameras than the naked eye.
1. Solar Wind & Particles
The Sun continuously emits charged particles (electrons and protons) in the solar wind. During solar storms, these particles are accelerated toward Earth.
2. Earth's Magnetic Field
Earth's magnetic field (magnetosphere) funnels these particles toward the magnetic poles. The field lines converge at both the North and South magnetic poles, creating the auroral ovals.
3. Atmospheric Collisions
Charged particles collide with atoms and molecules in Earth's upper atmosphere (thermosphere and ionosphere). These collisions occur at altitudes between 80-600 km (50-373 miles).
4. Light Emission
When particles collide with oxygen atoms, they excite electrons. As electrons return to their ground state, they emit photons of light. Different elements and altitudes produce different colors:
Key Point: Northern & Southern Hemispheres
The same solar wind particles create aurora in BOTH hemispheres simultaneously. When you see Aurora Borealis in Alaska, Aurora Australis is occurring at the same time in Antarctica. They are mirror images of each other, connected by Earth's magnetic field lines.
Auroral Oval
Ring-shaped region around each magnetic pole where aurora is most likely to occur. Expands during geomagnetic storms.
Auroral Substorm
Sudden brightening and movement of aurora. Caused by magnetic reconnection in the magnetotail.
Corona (Auroral)
Rare aurora formation where rays appear to converge directly overhead, creating a crown-like effect.
Proton Aurora
Aurora caused by protons rather than electrons. Typically appears as diffuse red or pink glow, often invisible to naked eye.
Discrete Aurora
Well-defined aurora with clear structures (curtains, rays, arcs). Most common type visible in Alaska.
Diffuse Aurora
Widespread, uniform aurora without distinct structures. Often appears as a faint glow covering large areas of sky.
The northern lights are always happening somewhere on our planet, but whether you can see them depends on two key factors: darkness and clear weather. During periods of low solar activity, aurora may only be visible at extreme northern latitudes and might appear quite dim. The main challenges for aurora watchers are daylight hours and cloudy conditions. In Fairbanks, Alaska, locals enjoy northern lights sightings on clear evenings for most of the year, with the best opportunities during the extended darkness of winter.
Prime northern lights viewing happens within the auroral zone, generally located between 60-70 degrees north latitude. Fairbanks, Alaska sits at 64.8°N, positioned right beneath the auroral oval - this makes it one of the world's top destinations for aurora watching. Other fantastic locations include Canada's northern territories, Greenland, Iceland, and the Scandinavian countries. Around Fairbanks specifically, spots such as Murphy Dome, Cleary Summit, and Chena Hot Springs provide excellent dark-sky viewing away from urban light pollution.
Optimal viewing typically happens during the darkest part of the night, usually from 10 PM to 2 AM. That said, northern lights can show up any time the sky is dark enough. In Alaska's winter season, darkness lasts much longer - beginning around 5 PM and continuing until roughly 8 AM the next morning, giving you many hours of potential viewing. While midnight tends to see peak activity, this changes based on current space weather. When geomagnetic storms are active, aurora can dance across the sky all night long.
Alaska's winter season, spanning September to March, offers ideal conditions because of the extended nighttime hours. The spring and fall equinoxes (March and September) frequently bring heightened aurora activity. While you can spot northern lights any time of year in Alaska - you just need sufficient darkness - the far north provides enough dark summer nights for viewing too. Still, the perfect combination of lengthy winter darkness and enhanced solar activity makes September through March the peak season for aurora enthusiasts.
Northern lights activity follows an 11-year pattern called the solar cycle. When the sun reaches solar maximum - the cycle's peak - it generates increased numbers of sunspots, solar flares, and coronal mass ejections, resulting in more frequent and powerful aurora shows. During solar minimum, aurora becomes less common but never completely stops. We're currently experiencing Solar Cycle 25, which is reaching its maximum around 2024-2025, creating exceptional viewing opportunities right now.
Fairbanks locals are no strangers to incredible northern lights shows and frequently stay up late capturing photos or simply enjoying the dynamic displays. Some people watch from their own backyards, but the most impressive views come from locations well away from urban light pollution. If you're visiting, choose an elevated spot with minimal light interference and an unobstructed view of the horizon - aurora can appear anywhere in the sky. In peak solar activity years, auroral substorms often begin south of Fairbanks. During quieter solar periods, they typically start to the north and peak around midnight.
Top viewing locations in the Fairbanks area:
For detailed information about lodging, guided tours, and other resources, check out www.explorefairbanks.com.
View Fairbanks aurora guide → | Cleary Summit → | Murphy Dome →
Safety reminder: Alaska's harsh winter conditions can quickly turn minor issues into serious emergencies in remote locations. When heading out for aurora viewing in cold weather, ensure you have appropriate cold-weather gear, vehicle emergency supplies, and safety equipment.
Absolutely! Northern lights are visible from Anchorage and South Central Alaska, though you'll need more intense space weather activity compared to more northern locations. Anchorage sits at 61.2°N and generally requires Kp levels of 5 or above for consistent aurora sightings, while Fairbanks can show aurora even at Kp 0-1 when skies are clear.
Prime viewing spots near Anchorage:
Successfully spotting aurora from Anchorage means timing your trip for active space weather (Kp 5+) and selecting spots with the least light interference. Use our Kp forecast charts and cloud coverage information to schedule your viewing. When powerful geomagnetic storms hit (Kp 6+), northern lights can sometimes be spotted even from within Anchorage city limits on clear evenings.
View Anchorage aurora guide → | South Central viewing guide →
Northern lights appear in numerous shapes and patterns, ranging from gentle arcs and bands to energetic, moving curtains. Popular forms you might see include:
During active periods, the shape and brightness can shift dramatically in just minutes. It's common to see several different forms happening at the same time during strong displays.
People have reported hearing sounds during aurora displays for hundreds of years, but scientists still debate whether this is real. Some watchers claim to hear crackling, hissing, or rustling noises during particularly intense displays. If these sounds are genuine, they're likely caused by electrical discharges happening close to the ground, possibly connected to the same mechanisms that create the aurora itself. Most observers don't hear anything, and the phenomenon isn't fully explained. Any sounds that do occur are usually extremely quiet and could be psychological responses or caused by other nearby environmental factors.
Yes, forecasting is possible to a certain degree. Space weather scientists can predict aurora activity using specialized forecast models. Our 3-day forecast gives dependable predictions of geomagnetic activity (measured by the Kp index) broken down into 3-hour time blocks. The 27-day forecast provides extended outlooks based on the sun's rotation pattern, though it's less accurate than shorter-term forecasts. Watching real-time solar wind data (including speed, particle density, and magnetic field direction) helps anticipate immediate aurora activity. Keep in mind that local cloud conditions matter just as much - even perfect space weather won't help if clouds are blocking your view. Our dashboard provides current conditions and forecast tools to help you plan.
The northern lights (also called aurora borealis) and southern lights (aurora australis) are natural light shows created when electrically charged particles streaming from the sun strike atoms and molecules high in Earth's atmosphere. These impacts energize the atmospheric particles, which then release that energy as visible light. Think of it like a neon sign - electrical energy excites gas particles, making them glow.
The auroral oval is a donut-shaped area encircling Earth's magnetic poles where northern lights appear most often. This zone isn't stationary - it grows and shrinks depending on current space weather conditions. When geomagnetic activity is low (low Kp values), the oval stays compact and near the poles. When activity increases (high Kp), the oval expands and shifts toward lower latitudes, bringing aurora within view of more observers. Fairbanks is positioned right beneath this auroral zone, which explains why it's such a fantastic place for aurora watching.
Aurora colors depend on which atmospheric gases are being energized and how high up the collisions happen. Green - the color you'll see most often - is produced by oxygen atoms at lower elevations (100-300 km). Red aurora comes from oxygen at higher altitudes (300-400 km). Blue and purple hues come from nitrogen molecules. Pink and yellow are uncommon and happen when these gases mix. Colors and brightness can shift dramatically during active displays, sometimes changing in just seconds.
Northern lights typically form between 80 and 500 kilometers (50-310 miles) above the ground. The familiar green aurora you see most often happens around 100-300 km (60-185 miles) up. Red aurora forms higher, at approximately 300-400 km (185-250 miles). Blue and purple colors from nitrogen appear lower, around 80-100 km (50-60 miles). These heights are far above commercial airplanes (which cruise around 10-12 km) but below most satellites orbiting Earth.
Solar wind is a constant flow of electrically charged particles (protons and electrons) streaming outward from the sun's corona, or outer atmosphere. This particle stream moves through space at velocities between 300 and 800 kilometers per second. When these solar particles meet Earth's magnetic field, they can funnel down into the atmosphere near the poles, generating aurora displays. The solar wind's speed, particle density, and magnetic field direction (especially the Bz component) all influence aurora activity. The ideal conditions happen when Bz turns southward (negative) along with high particle density and fast speeds.
The Kp index measures geomagnetic disturbance on a scale from 0 to 9, showing how much Earth's magnetic field is being affected by solar wind. Here's what the numbers mean: Kp 0-2 indicates quiet conditions, Kp 3-4 means unsettled to active, Kp 5 signals a minor geomagnetic storm, Kp 6 indicates moderate storm activity, Kp 7 represents strong storms, and Kp 8-9 means severe to extreme storms. Higher Kp values mean aurora becomes visible at lower latitudes and appears more intense. Fairbanks can show aurora even at Kp 0-1 when skies are clear, while Anchorage usually needs Kp 5 or higher for consistent sightings.
Complete Kp index guide → | View current Kp index → | Historical Kp data →
Our dashboard shows live space weather information you can use right now. Keep an eye on the current Kp index reading, solar wind measurements (Bz direction, particle density, and speed), and overall geomagnetic activity levels. When Bz turns southward (negative) along with high particle density and elevated Kp values, you've got promising aurora conditions. Don't forget: clear weather is crucial - the best space weather in the world won't help if clouds are covering the sky. Check our cloud coverage information for your viewing location to help plan when to head outside.
Our 30-minute forecast maps use NOAA's OVATION model to show current and upcoming aurora activity. These maps refresh every half hour and show both the likelihood and energy levels of aurora for the Northern and Southern Hemispheres. The color coding tells you the intensity: dark green (0-1 ergs/cm²) means weak activity, green (1-4 ergs/cm²) indicates moderate activity, yellow (4 ergs/cm²) signals strong activity, while orange/red (>4 ergs/cm²) indicates very strong activity. This is your most up-to-the-minute forecast and helps you determine whether it's worth stepping outside right now.
The 3-day forecast displays predicted Kp index values broken into 3-hour time blocks. This is NOAA's most dependable forecast, refreshed every day at 22:05 UTC. Use it to schedule your aurora watching for the coming days. For Fairbanks, watch for times when Kp reaches 3 or higher. For South Central Alaska (including Anchorage), you'll want Kp 5 or above. This forecast helps you pick the optimal nights for late-night viewing or plan a dedicated aurora hunting trip.
The 27-day forecast gives you an extended outlook based on the sun's rotation pattern. Since the sun rotates about every 27 days, solar features that created aurora activity can come back around. While this forecast isn't as precise as the 3-day version, it can help you spot potential active periods several weeks ahead. NOAA updates it weekly every Monday at 15:00 UTC. It's useful for long-range planning, but make sure to check the 3-day forecast as your viewing date gets closer.
Explore Alaska's best aurora viewing locations on this interactive map. Click on markers to see current Kp index, HPI (Aurora Power Index), and viewing status for each location.
Popular roadside pullout locations near Fairbanks for aurora viewing. These spots offer good northern horizon views and are easily accessible.
Elevated pullout on Steese Highway with excellent northern horizon views. Popular with photographers.
Distance: ~20 miles from Fairbanks
View on Google MapsWide pullout area with minimal light pollution. Good for extended viewing sessions.
Distance: ~25 miles from Fairbanks
View on Google MapsMultiple pullout areas along the road to Chena Hot Springs. Less crowded than summit locations.
Distance: ~15-30 miles from Fairbanks
View on Google MapsConvenient location with good northern exposure. Popular with locals for quick aurora checks.
Distance: ~10 miles from Fairbanks
View on Google MapsBest pullout locations near Anchorage and the Mat-Su Valley. Note: Aurora visibility in South Central Alaska typically requires Kp 5+ for good viewing.
Elevated pullout with panoramic northern views. Best during high Kp events (5+).
Distance: ~60 miles from Anchorage
View on Google MapsMultiple pullouts along Seward Highway with northern horizon views over water. Dramatic backdrop.
Distance: ~20-40 miles from Anchorage
View on Google MapsLess light pollution than Anchorage. Good northern exposure with mountain backdrop.
Distance: ~25 miles from Anchorage
View on Google MapsOpen area with minimal obstructions. Accessible pullouts along Knik-Goose Bay Road.
Distance: ~35 miles from Anchorage
View on Google MapsRemote pullout locations in Interior and Arctic Alaska. These areas offer some of the best aurora viewing conditions due to minimal light pollution and high latitude.
Multiple pullouts along the scenic Denali Highway. Excellent dark sky conditions with minimal light pollution.
Distance: ~120 miles from Fairbanks
View on Google MapsRemote pullouts along the Dalton Highway north of Fairbanks. Extreme dark sky conditions ideal for aurora photography.
Distance: ~70+ miles from Fairbanks
View on Google MapsPullouts along Steese Highway heading northeast from Fairbanks. Good access to elevated viewing areas.
Distance: ~30-60 miles from Fairbanks
View on Google MapsPullouts near the Arctic Circle sign and surrounding areas. Some of the darkest skies in Alaska.
Distance: ~200 miles from Fairbanks
View on Google MapsUse the accordion sections below to explore detailed guides on reading forecasts, photography, viewing tips, satellite data, and when to trust forecasts.
Relying solely on apps! Even if apps say "low activity" or Kp is 0-1, if you're in Fairbanks and skies are clear, go outside and look north.
Remember: Apps are tools, not guarantees. The aurora can appear when apps say it won't, and it can fail to appear when apps say it will. The best predictor is clear skies + your location + real-time satellite data.
Most Reliable Region: Located under the auroral oval, Interior Alaska sees aurora activity even at very low Kp values.
Polar Cap Region: Even more reliable than Interior, but with extreme weather challenges.
Moderate Reliability: Requires higher Kp values, but more accessible and milder weather.
Least Reliable Region: Cloudy weather and southern latitude make viewing challenging.
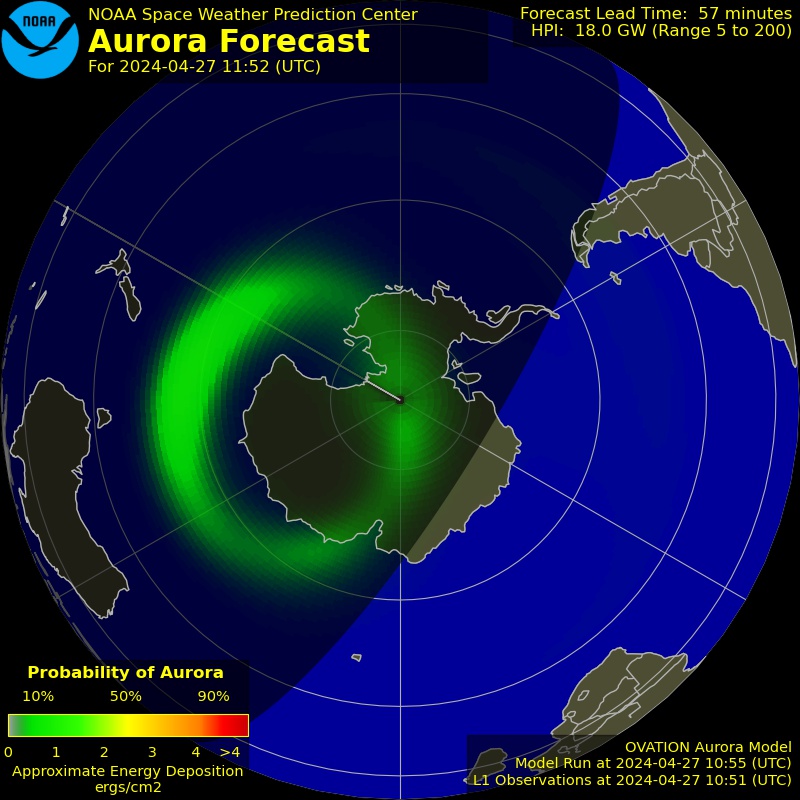
Understanding NOAA's aurora prediction displays
NOAA's aurora forecast maps show a top-down view of Earth from the North Pole. The circular display represents the Northern Hemisphere, with Alaska positioned in the upper portion of the circle. This bird's-eye perspective helps you understand where aurora activity will be strongest across different regions.
The forecast map is divided into wedge-shaped sections (like pie slices), each representing a 4-hour time window. These time slices help predict when aurora activity will be strongest in different regions:
The color intensity on the forecast maps indicates energy deposition in ergs per square centimeter (ergs/cm²). Higher energy deposition indicates stronger aurora activity.
How far ahead the prediction extends (typically 30-90 minutes)
Total aurora energy in gigawatts (GW). Higher = more intense aurora.
Shows the variability in the prediction
Understanding the science behind NOAA's aurora forecast maps
The OVATION (Oval Variation, Assessment, Tracking, Intensity, and Online Nowcasting) model is an empirical model of the intensity of the aurora developed at the Johns Hopkins University, Applied Physics Laboratory by Patrick Newell and co-workers1.
The model uses the solar wind velocity and interplanetary magnetic field measured at the L1 orbit position at 1.6 million km (1 million miles) upstream from Earth as input and calculates three types of electron precipitation and the proton precipitation which strongly correlate with the aurora.
An estimate of aurora viewing probability can be derived by assuming a linear relationship to the intensity of the aurora. This relationship was validated by comparison with data from the Ultraviolet imager (UVI) instrument on the NASA Polar satellite2.
On occasion, the input solar wind data are either contaminated or unavailable. In those instances, an alternative estimate of the solar wind forcing, based on the current Kp geomagnetic index is used to drive the OVATION model.
When this occurs, there is no forecast lead time.
1. Newell, P. T., T. Sotirelis, and S. Wing (2009), Diffuse, monoenergetic, and broadband aurora: The global precipitation budget, J. Geophys. Res., 114, A09207, doi:10.1029/2009JA014326
2. Machol, J. L., Green., J. C., Redmon, R. J., Viereck, R. A., Newell, P. T., (2012), Evaluation of OVATION Prime as a forecast model for visible aurorae, Space Weather, 10, 3, doi.org/10.1029/2011SW000746
For more information on the OVATION model and aurora products, visit NOAA Space Weather Prediction Center.
Measures geomagnetic activity on a scale of 0-9. Higher values indicate stronger aurora activity. Kp 5+ means good viewing opportunities in Alaska.
The total strength of the interplanetary magnetic field in nanoteslas. Stronger fields can trigger more intense aurora.
Negative Bz values enhance aurora activity by allowing solar wind to interact with Earth's magnetic field. Bz of -10 nT or lower is ideal!
Forecast Shows: Kp 2, HPI 15 GW, Bz -3 nT, Clear skies predicted
What This Means: Even though Kp is low, you're in Interior Alaska with clear skies. The negative Bz and moderate HPI suggest some activity.
Action: Go outside and look north! In Fairbanks, Kp 2 with clear skies often produces visible aurora, especially with negative Bz. You might see faint green bands on the northern horizon or even overhead displays.
Forecast Shows: Kp 4, HPI 25 GW, Bz -2 nT, Partly cloudy
What This Means: Kp 4 is borderline for South Central. The HPI is moderate, and Bz is slightly negative but not strongly so.
Action: Maybe, but not ideal. If you're patient and have a clear view to the north, you might see faint aurora on the horizon. However, Kp 5+ would be more reliable. Consider waiting for a better forecast or driving to a darker location away from city lights.
Forecast Shows: Kp 6, HPI 60 GW, Bz -8 nT, Clear skies, High density (8 particles/cm³)
What This Means: Excellent conditions! High Kp, strong negative Bz, high HPI, and high particle density all indicate strong aurora activity.
Action: Definitely go out! This is a great forecast for South Central. You should see aurora overhead with vibrant colors. Head to Hatcher Pass, Turnagain Arm, or another dark location away from Anchorage's light pollution. Expect to see green, possibly red, and potentially even purple aurora dancing overhead.
Forecast Shows: Kp 1, HPI 10 GW, Bz +2 nT, Clear skies, -35°F
What This Means: Very low Kp and positive Bz (not favorable), but you're in the polar cap region where aurora is almost always present.
Action: Go out if you can handle the cold! Even with low Kp and positive Bz, North Slope locations see aurora on most clear nights. You'll likely see faint green bands. The main challenge is the extreme cold - dress appropriately and don't stay out too long.
✓ Check These First:
✓ Then Check Space Weather:
Remember: In Interior and North Slope Alaska, clear skies often trump low Kp values. In South Central and Southeast, you need both high Kp AND clear skies for reliable viewing.
Essential camera settings and equipment for aurora photography
→ Shoot in RAW format for maximum editing flexibility
→ Include foreground elements (trees, mountains) for composition
→ Use manual focus and set to infinity (test before it gets dark)
→ Turn off image stabilization when using a tripod
→ Take test shots and adjust settings as aurora intensity changes
→ Keep camera and batteries warm in your jacket between shots
Essential etiquette, safety, and practical advice for Northern Lights viewing in Alaska
Interior Alaska (Fairbanks Area)
South Central Alaska (Anchorage Area)
North Slope (Utqiagvik/Prudhoe Bay)
Local Aurora Groups: Join Facebook groups like "Fairbanks Aurora Chasers," "Anchorage Aurora Watchers," or regional groups for real-time sightings, road conditions, and local knowledge.
Respect Native Lands: Many viewing locations are on or near Native lands. Respect private property, follow posted rules, and consider supporting local Native-owned tour operators.
Tour Operators: Consider guided tours for first-time visitors - they know the best spots, handle logistics, and provide safety support. Many offer photography-focused tours.
Local Knowledge: Talk to locals! Alaskans are friendly and often share tips about current conditions, best spots, and safety considerations.
Aurora Forecasts: Check multiple sources - this site, NOAA, SpaceWeatherLive, and local weather services. Compare forecasts and trust local weather more than distant Kp predictions.
Understanding real-time space weather data from satellites
Most Important for Aurora! This is the north-south orientation of the interplanetary magnetic field.
The total strength of the interplanetary magnetic field.
Number of solar wind particles hitting Earth.
How fast the solar wind is traveling.
Bz < -5 nT + High Density (5+ particles/cm³) + High Speed (500+ km/s) + Kp ≥ 5 = Excellent Aurora Conditions!
Learn more and see real-time data at SpaceWeatherLive.com
Location Advantage: Under the auroral oval, these regions can see aurora even with less-than-ideal satellite data.
Stricter Requirements: Need stronger conditions due to southern latitude.
Most Challenging: Requires strongest conditions and clear weather.
1. Check Satellite Data First: Look at Bz, density, and speed on this dashboard. If Bz is strongly negative (-5 nT or lower) and density is high, conditions are favorable.
2. Check Kp Index: Verify Kp matches your location's threshold (Interior: 0-1+, South Central: 5+, Southeast: 7+).
3. Check Local Weather: Cloud cover is often the limiting factor. Clear skies are essential regardless of space weather conditions.
4. Monitor Trends: Watch if Bz is trending more negative or if density is increasing. Improving conditions may mean aurora is strengthening.
5. Set Alerts: Use this site's alert system to notify you when conditions reach your threshold.
Pro Tip: In Interior Alaska, if Bz is negative (even slightly) and skies are clear, go outside regardless of other numbers. Your location advantage often overrides less-than-perfect satellite data.
Fairbanks-based tours to Coldfoot and Prudhoe Bay
Specialized aurora photography and viewing tours
Official Fairbanks visitor guide with tour listings
Aurora viewing combined with wildlife experiences
Guided photography tours for glaciers, wildlife, and landscapes
Short excursions highlighting scenic spots and wildlife
Private tours showcasing breathtaking Alaskan scenery
Winter photo tours focusing on frozen landscapes and aurora
Photo excursions exploring Denali's landscapes
Multi-day photo tours focusing on wildlife and landscape photography
Multi-day expeditions focusing on bear viewing and photography
Small group tours focusing on wildlife and nature photography
Comprehensive Alaska tours including aurora viewing
Iconic hot springs resort with aurora viewing tours
Luxury igloos with glass ceilings for aurora viewing
Mountain lodge with excellent aurora viewing
Remote Arctic Circle location for aurora viewing
Private log cabins at Hatcher Pass entrance
Luxury log home on 8 acres with wildlife
Cabins near Matanuska Glacier with mountain views
B&B with views of Knik Arm and Chugach Mountains
B&B between Palmer and Wasilla with glacier views
Premier resort with luxury accommodations and mountain access
Charming B&B near Mount Alyeska base
Luxury remote lodge near Denali summit, helicopter access
University of Alaska Fairbanks Geophysical Institute
Official NOAA Space Weather Prediction Center
NOAA experimental aurora forecast dashboard
Real-time space weather monitoring and forecasts
Aurora alerts and notifications service
Mobile app for aurora forecasts and alerts
Lancaster University aurora monitoring
Comprehensive space weather mobile app
European aurora forecast and alerts
All real-time space weather data is sourced from the NOAA Space Weather Prediction Center (SWPC)
Data updates every 60 seconds. This site uses the NOAA SWPC JSON API endpoint (services.swpc.noaa.gov/json/) and Products API (services.swpc.noaa.gov/products/) to fetch real-time space weather data.
Reference: NOAA SWPC Data Access
Base URL: https://services.swpc.noaa.gov/json/
Planetary K-Index (1-minute data)
planetary_k_index_1m.json
Real-time 1-minute resolution Kp index data for current conditions monitoring
Used for: Real-time space weather conditions, current Kp display
View JSON →Real-Time Solar Wind - Magnetic Field
rtsw/rtsw_mag_1m.json
Interplanetary magnetic field (Bt, Bz) measurements
Used for: Interplanetary Magnetic Field Charts (Bt, Bz), Solar Wind Conditions
View JSON →Real-Time Solar Wind - Wind
rtsw/rtsw_wind_1m.json
Solar wind density and speed measurements
Used for: Solar Wind Density Chart, Solar Wind Speed
View JSON →F10.7 cm Radio Flux
f107_cm_flux.json
10.7 cm solar radio flux measurements
Used for: Solar Flux display, Solar Cycle Status
View JSON →OVATION Aurora Model
ovation_aurora_latest.json
Aurora probability and energy deposition forecasts
Used for: OVATION Alaska Aurora Data, Aurora Probability Maps
View JSON →Geospace DST Index (1-hour)
geospace/geospace_dst_1_hour.json
Disturbance Storm Time (DST) index for geomagnetic activity
Used for: DST Index Chart, Historical Data
View JSON →Solar Flare Probabilities
solar_probabilities.json
Probability forecasts for X-ray flares (M-class and X-class)
Used for: Solar Flare Probabilities section
View JSON →Predicted F10.7 cm Flux
predicted_f107cm_flux.json
Forecasted 10.7 cm radio flux values
Used for: Solar Flux Forecast Chart
View JSON →Base URL: https://services.swpc.noaa.gov/products/
Space Weather Alerts
alerts.json
Active space weather watches, warnings, and alerts
Used for: Space Weather Alerts display, Active Alerts modal
View JSON →NOAA Space Weather Scales
noaa-scales.json
Current G-scale (geomagnetic), R-scale (radio blackout), and S-scale (solar radiation) values
Used for: NOAA Scales display (Radio Blackouts, Solar Radiation, Geomagnetic Storms)
View JSON →Planetary K-Index Forecast
noaa-planetary-k-index-forecast.json
3-day Kp index forecast values
Used for: 3-Day Forecast section, Kp Forecast display
View JSON →Planetary K-Index (3-hour data)
noaa-planetary-k-index.json
Historical 3-hour Kp index values for charting and historical analysis
Used for: Kp Index Historical Bar Chart, Kp Index Breakdown Table
View JSON →10.7 cm Flux (30-day)
10cm-flux-30-day.json
30-day historical 10.7 cm radio flux data
Used for: 30-Day Flux historical data, Solar Cycle analysis
View JSON →Base URL: https://services.swpc.noaa.gov/images/
Aurora Forecast Maps
30-minute aurora probability forecasts for Northern and Southern Hemispheres
DRAP Geomagnetic Map
drap_f05_n-pole.png →
Dynamic Radiation Atmosphere Propagation model visualization
Kp Index Range Maps
Aurora visibility maps at different Kp index levels (Kp=3, 5, 7, 9)
Source: NOAA SWPC Image Archive
Experimental Aurora Forecasts
Tonight's and tomorrow night's aurora viewline forecasts
Northern Lights Alaska (NLAK) - Your comprehensive real-time aurora activity monitor for Alaska. Track live aurora forecasts, geomagnetic activity (Kp index), solar wind conditions, and space weather data from NOAA's Space Weather Prediction Center. Get accurate aurora viewing predictions for Fairbanks, Anchorage, and all of Alaska with our advanced monitoring tools, 3-day forecasts, historical data comparisons, and expert viewing guides.
Monitor aurora borealis activity in real-time with live updates every 60 seconds. Our platform provides detailed information about aurora colors (red, orange, yellow, green), viewing conditions, HPI (Hemispheric Power Index) guidelines, moon phase impacts, and Alaska-specific viewing tips. Access NOAA's OVATION Aurora Model maps, DRAP geomagnetic forecasts, solar flare probabilities, and comprehensive space weather data to plan your perfect aurora viewing experience in Alaska.
Whether you're in South Central Alaska (Anchorage, Mat-Su, Kenai Peninsula) or Far North Alaska (Fairbanks, Interior, Arctic), our site provides location-specific aurora viewing recommendations based on real-time geomagnetic activity, solar wind conditions, and atmospheric data. Learn about aurora science, historical events, photography techniques, and essential gear for successful aurora hunting in Alaska's unique viewing conditions.
Northern Lights Alaska is a comprehensive real-time aurora activity monitoring platform designed specifically for Alaska residents and visitors. Launched in December 2025, the application provides live space weather data, aurora forecasts, and viewing recommendations to help you plan the perfect aurora viewing experience. The platform integrates data from NOAA's Space Weather Prediction Center to deliver accurate, up-to-date information about geomagnetic activity, solar wind conditions, and aurora probability across Alaska.
Version 1.0.1 continues to provide the most current space weather information for planning your aurora viewing experience in Alaska. All data is sourced directly from NOAA's Space Weather Prediction Center and updated every 60 seconds.
Astronomy-safe dim (20% or less) Recommended for preserving night vision (20-50%) Normal Field Mode (50-100%)
Images will be displayed in full color Images will have a red tint overlay Images will be displayed in black & white